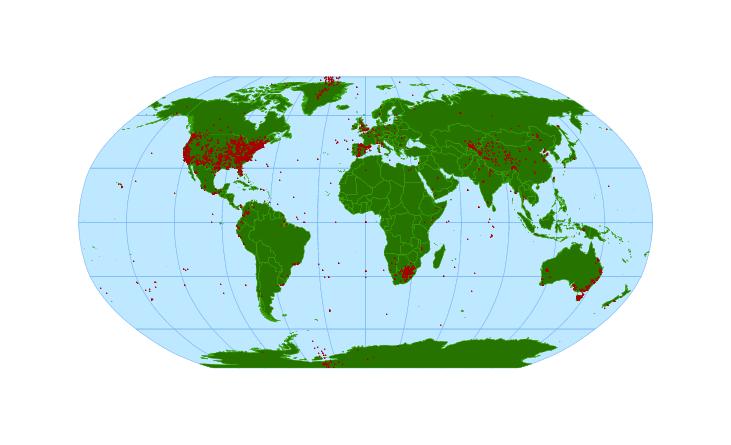
Here is a static map (as of May 8, 2013) showing geographic locations of some of the plots which
have been generated by Splat! (Map courtesy of ECU Cartography Department - Thanks!)
Splat Web Interface
Splat! is a program which utilizes terrain data
(from Space Shuttle missions)
to create
plots for determining coverage areas provided by various antenna configurations,
or to analyze the radio path between two locations.
Splat! is of particular interest to the
Amateur Radio Community. This web page provides a web interface to
the splat! program.
Thanks to the East Central University (Ada, Oklahoma) Computer Science Department!
73 de Bill W5GFE, w5gfe at arrl dot net
I would like to identify other
websites who would be willing to also host a Splat! web interface like
the one on this site. Please check out the "download" section below.
I would provide a link on this site to those other
sites. If you
are interested in becoming a Splat! website, please drop me a line: w5gfe at arrl dot net
There are seven items of interest on this page:
Caveat!
World wide terrain data is now available, but "city" and "political boundary" data is available only for North America at this time
We need some information in order to create plots or profiles for you.
You need to know that we will "file" the geographical information that you provide
so that it appears on plots generated by other users, as well as by
you. This will ultimately result in a "ham station" map of the area, but
your station's geographic location will
be disclosed to anyone who uses these pages to create plots or profiles.
In order to use the Splat! software you must first "register" your
station location by following the
Registration Link
You will need to know your latitude, longitude, and the height of your antenna.
Here is a list of Registered Stations
Here are the last 30 Log Book entries and Activity Graphs
If you create plots involving more than one station, each station must
be registered.
Registration involves providing only geographic information. No
email address is collected. Please see the Caveat.
Coverage plots involve only your own station, and provide a (rather large)
PNG image that uses various colors to show expected signal strength on
a map that contains your QTH. The terrain data
is depicted on a gray-scale map, using data from space shuttle missions.
The data includes HAAT calculations.
Follow This Link for Coverage Plots.
These plots use geographic data for two stations to produce
profiles of the paths between those two stations. If the two stations
are separated by long distances (say Texas to Connecticut) you may get
some really funny answers. Two stations may lie in different states
so long as the physical separation is not too great.
Follow This Link for path profiles.
These plots take a long time (up to six or seven minutes!) to create. Multiple
transmitter sites are combined to illustrate the total coverage possible.
Follow This Link for Multiple Transmitter path profiles.
How to Download This Website for your own use
You can download splat! itself, as well as the
components of this web site for your own local use. You will need:
- Some form of Linux
- A C compiler (gcc is good)
- Perl 5.8.0 or better, with CGI and DBI packages
- Apache web server
- MySQL 5.0.0 or better
- enough privileges to be able to configure Apache, and MySQL
- About 10 GB of disk for a complete installation
- gnuplot 3.7 or better
Check out the FTP Downloads Directory
Credits
All credit for splat! belongs to John Magliacane KD2BD.
I encourage you to visit his site
and enjoy his talents! 73 de Bill, W5GFE w5gfe at arrl dot net
Thanks also to Walter, K1CMF, for pointing out an error (mine)
in the Longley-Rice profiles!
w5gfe at arrl dot net
Last modified: Thu Jun 2 21:55:14 CDT 2011